By Andrea Pellandra and Giulia Del Panta
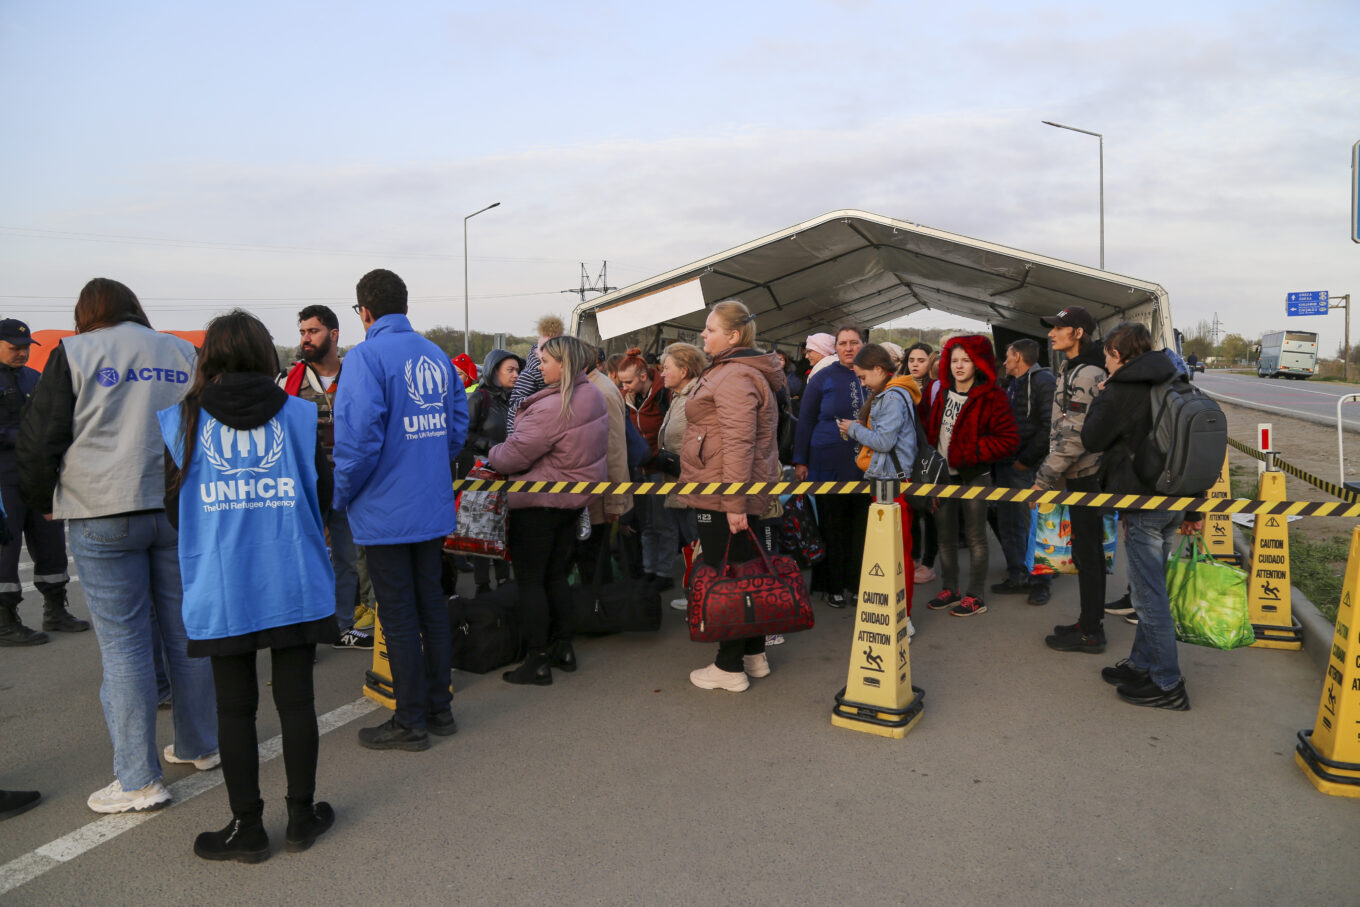
In May 2022, UNHCR, the UN Refugee Agency, announced that the number of forcibly displaced people had crossed the grim milestone of 100 million.[1] The steep increase in displacement figures was partly due to the Russian invasion of Ukraine, which led to the most significant refugee crisis on European soil since the Second World War. This figure was an increase of over 10% compared to the official figure of 89.3 million as of end-2021, but this figure was not reported officially by UNHCR until June 2022 when the Global Trends report was published.
UNHCR publishes official global figures on forcibly displaced populations biannually with a lag of around six months, most notably in its Global Trends and Mid-Year Trends reports, since the early 2010s. This means that up until now, an important gap in displacement figures has existed, and that senior management and decision-makers have not been able to have a clear picture of the extent of the global displacement situation at any given time.
To overcome this gap, the Agency developed the UNHCR Nowcasting dashboard to provide an estimate of actual forced displacement figures when official figures are unavailable with an accuracy of close to 99% compared to officially published figures at the global level. These nowcasts are incredibly important in the humanitarian sector as they inform UNHCR and its partners of the rapidly changing situation in almost real-time and enable more efficient decision-making such as emergency resource allocation.
Nowcasts are usually accurate estimates of the official figures, which are published a few months later. Originally a term from meteorology, nowcasting combines ‘now’ and ‘forecasting’ and refers to the prediction of the present state of a target variable, for example refugee population, for which data is typically published with a considerable lag. The publishing delay of official figures is usually due to the collection, processing, quality control and validation of the data. Therefore, nowcasts use various methods ranging from statistical or econometric models to machine learning models to exploit the information provided by a set of indicators typically correlated with the target variable. In a similar fashion, economists, for example, often use nowcasting to estimate variables such as GDP, trade and inflation.
The UNHCR Nowcasting dashboard focuses on refugees and asylum-seeker figures and to populate it, the UNHCR Data Science team draws on three main sources of data. The first data source is proGres[2], UNHCR’s corporate case management system, which the organization uses to register the people we serve. It is deployed in almost 130 countries covering around half of the world’s refugees and asylum-seekers population. It is one of the most accurate data sources available as the data is maintained, validated, and updated daily. It is also consistent with the official data published in the annual Global and Mid-Year Trends statistical reports of UNHCR. Most of this data can be ingested directly into the dashboard as it is updated in real time.
However, in countries where governments register refugees and asylum-seekers without the help of proGres, alternative data sources must be used. In this case, government websites or publicly available databases, such as Eurostat, where governments regularly publish monthly or quarterly asylum application and decision data, are used. These data are then downloaded or scraped, formatted, and checked for consistency. Since these data are usually published with a lag of a few months as well, time-series econometric models are used to nowcast the data. These models use the available historical asylum applications and decisions to analyze the underlying trends in the data and accurately nowcast current values.
In the remaining cases, where neither proGres data nor regularly published asylum data are available, UNHCR uses a gravity model of migration to nowcast forced displacement flows between a country of origin and a country of asylum, so-called bilateral flows. The gravity model of migration is an economic model adapted from the international trade literature that views forced displacement as the result of specific variables that either attract an individual or household to move to a specific country of asylum (pull factors) or force the individual to move from their place of habitual residence (push factors). These factors include conflict, violent events, socioeconomic variables, political factors, cultural and historical circumstances, geographical proximity, and many others. By estimating the impact of the push and pull variables on forced displacement, the model applies currently available information on covariates to the most recently available forced displacement flow figures from UNHCR to predict future refugee arrivals.
In summary, data from UNHCR’s registration system are combined with estimates from statistical and econometric models where actual data are unavailable. Subsequently, these figures are published in the UNHCR nowcasting dashboard on the second week of every month.
As with all empirical methods, nowcasting estimates come with limitations. While UNHCR’s Data Science team continues to work to improve the accuracy of the nowcasts by exploring different methods and data sources and assessing their accuracy in comparison to the officially published figures, low data availability and unforeseen crises provide challenges even for the best models. While the accuracy in the estimation of the global refugee population is close to 99% as compared officially published figures,, different data sources come with different levels of data quality, which in turn, influences the accuracy of the nowcasted data for a specific country or country pair. Communication around these issues is crucial, which is why prediction intervals have been included in the dashboard, together with the description of the different data sources and models. Users need to understand the limitations and background of the data that are displayed in the dashboard so that the communication around their future use is accurate and consistent.
Despite its challenges and limitations, this work is an excellent example of the enormous potential to improve data in the humanitarian sector. It allows for greater understanding of current displacement situations by reducing the gap in the release of forced displacement figures from six months to two weeks and creates an additional tool to support the international community with the challenges of decision-making in a constantly evolving environment. While the statistical methodology continues to be assessed and improved regularly, the Nowcasting dashboard remains an internal tool for UNHCR with a view of releasing it publicly in 2023.
[2] Profile Global Registration System